Product Overview
Dips
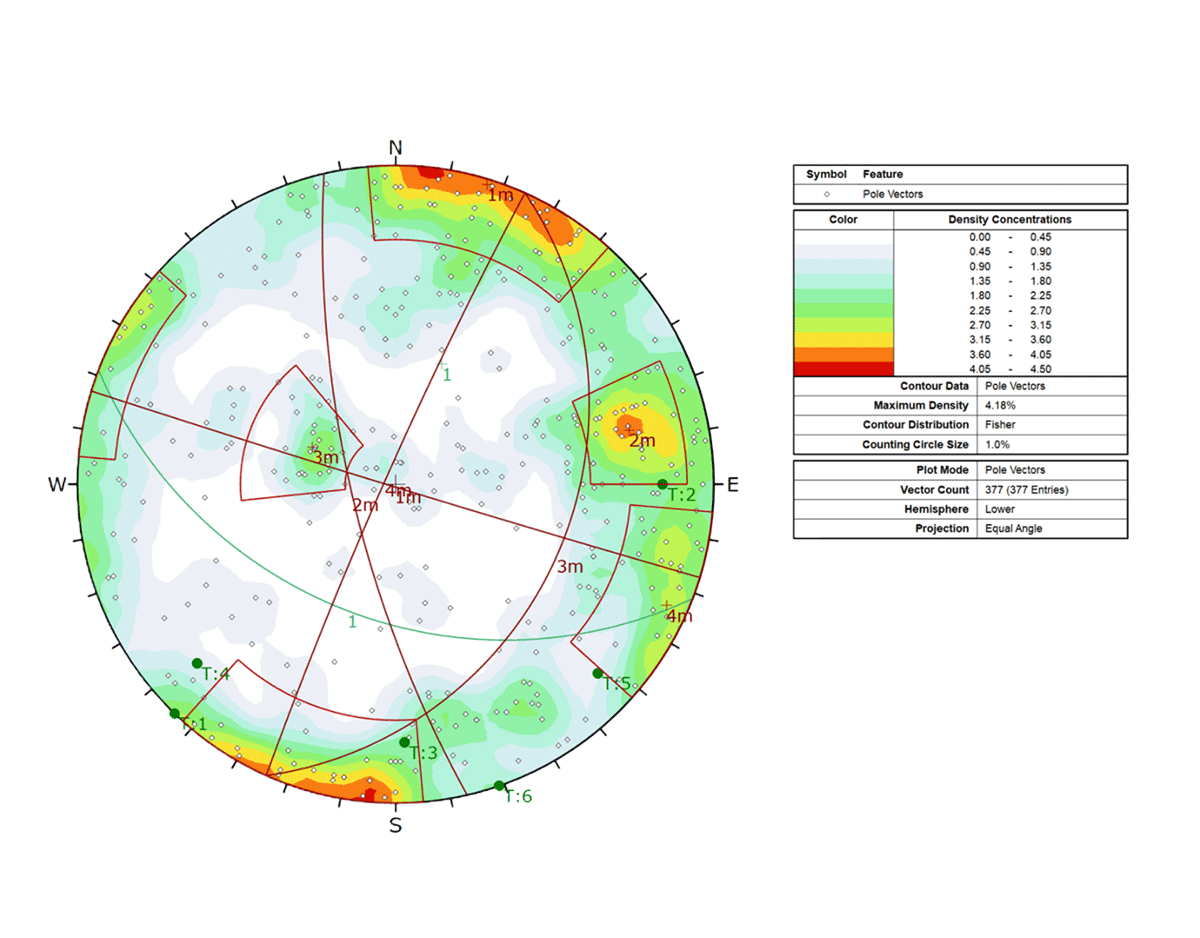
Stereographic Projection Analysis
Designed for interactive analysis of orientation based geological data. Visualize orientation vectors, density contours, planes, intersections, and traverses. Draw user-defined planes, sets, and annotative tools.
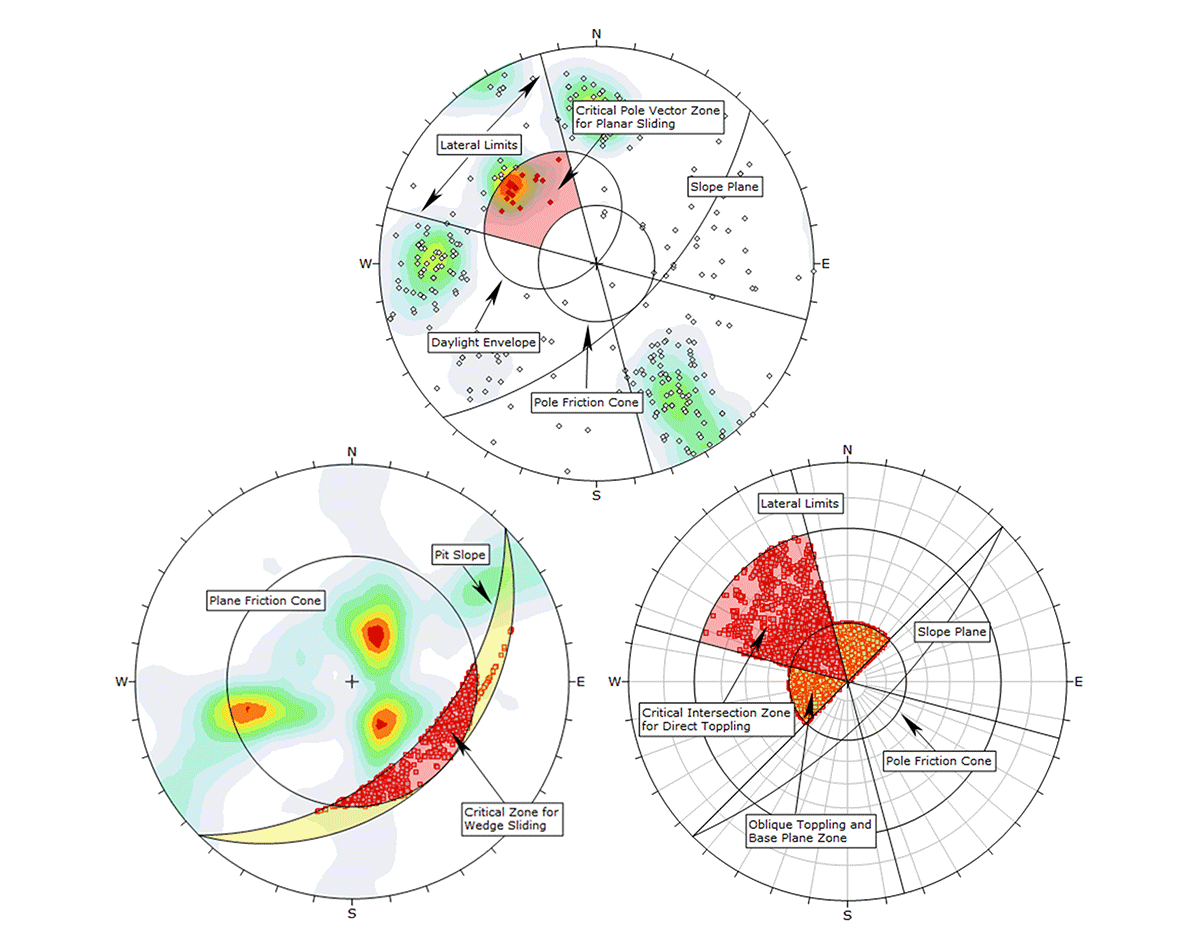
Kinematic Analysis
Identify critical zones, vectors, and intersections on a stereonet overlay with the kinematic analysis of planar and wedge sliding, or direct and flexural toppling failure modes. Export kinematic results to excel, containing critical vectors and intersections for all failure modes.
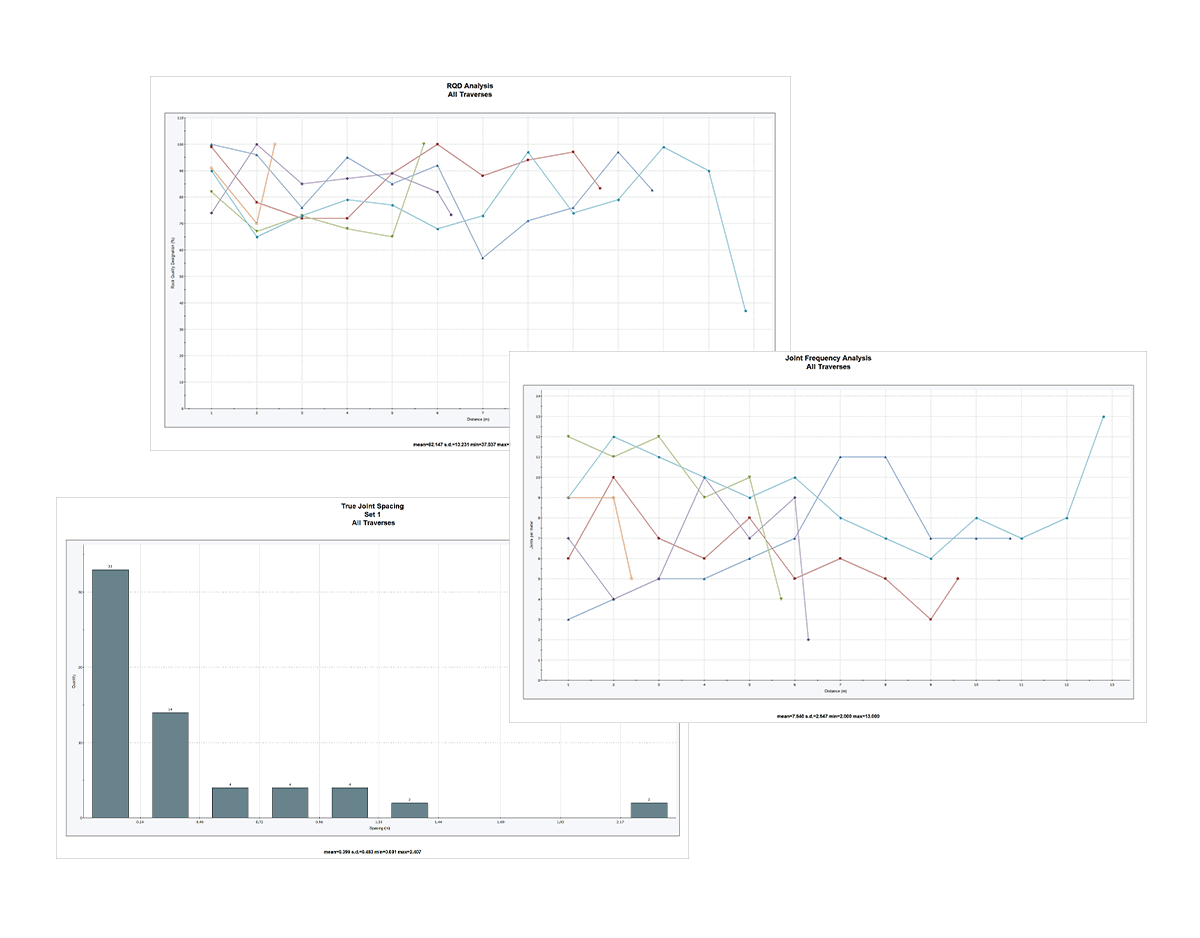
Jointing Analysis
Three built-in analysis options: Joint Spacing to calculate true or apparent spacing between joints within a set, RQD Analysis for assessing Rock Quality Designation, and Joint Frequency for counting the occurrence of joints along each 1D distance interval, on a linear or borehole traverse.
Specifications
File Output :
Export to Excel
JTDIST utility program—define up to five synthetic joint sets, generate a Dips file
Save processed file
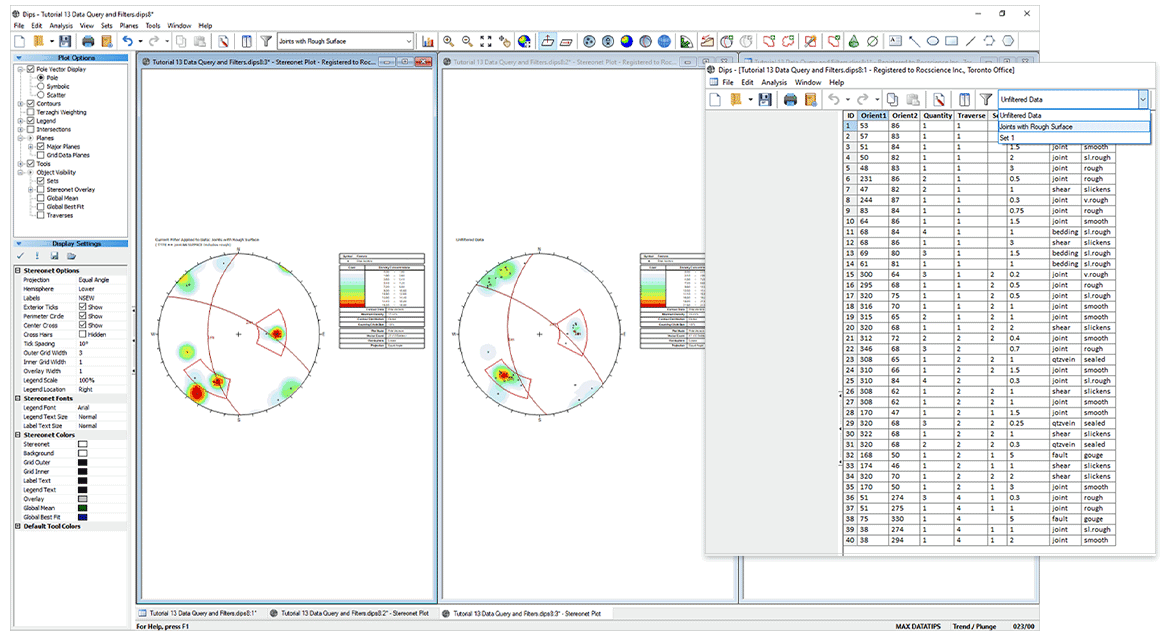
Filtering / Attribute Analysis :
Create charts or symbolic pole plots based on any data column in the file
Edit symbols, create symbol master list
Filter by set
Histogram, line or pie charts
Plot qualitative/quantitative data
Powerful database query, easily create data subsets
Input Data :
Curved borehole analysis—input collar and survey files
Declination for magnetic/azimuth correction
Distance column
Integrated spreadsheet
Linear/planar orientation data
Quantity column for multiple identical data entries
Unlimited number of columns for additional data
Jointing Analysis :
Joint Frequency (unweighted or weighted)
Joint Set Spacing (true spacing or apparent spacing)
Metric or Imperial units
Plot selected traverses or all traverses
RQD Analysis (discrete or moving interval)
Kinematic Analysis :
Apply declination to slope dip direction
Apply Terzaghi weighting to pole count
Direct toppling
Export results to Excel
Flexural toppling
Highlight critical zones
Highlight slope plane on stereonet
Lateral limits
Planar sliding
Poles, dip vectors, intersections
Kinematic sensitivity analysis: sensitivity plots of slope dip, dip direction, friction angle, lateral limits, for planar sliding, wedge sliding, toppling analysis
Wedge sliding
Orientation Formats :
Dip/Dip direction
Multiple formats in one file using traverses
Oriented core (alpha/beta)
Strike/Dip (right or left hand rule for strike)
Trend/Plunge (linear data)
Projections :
Equal angle, equal area
Upper/lower hemisphere
Statistical Analysis :
Best fit plane through poles (fold analysis)
Confidence and variability cones
Fisher distributions for contour plots
Fuzzy cluster analysis for automatic detection of joint sets
Global mean vector
Mean vector calculation
Statistics listed in Info Viewer
User-defined set windows for orientation (pole) clusters
Stereonet Plots :
3D stereosphere
Contour arbitrary data on stereonet
Contour plot
Customize display options
Overlay of contours, poles, planes, intersections
Planes plot
Pole or dip vector mode
Pole plot
Plot traverse orientations on stereonet
Rosette plot
Scatter plot
Symbolic plot
View intersections
Stereonet Toolkit :
Add planes (rubber plane for interactive data analysis)
Data rotation about arbitrary axis
Daylight envelopes for sliding analysis in slope design
Drawing tools, text annotations
Intersection calculator
Onscreen angle measurement
Onscreen pole identification
Plot lineations on planes
Polar/equatorial grid overlay
Small circles about any axis (e.g. friction circles, toppling bounds)
User-defined trend/strike reference line
Traverses :
Bias correction (Terzaghi weighting)
Borehole (oriented core)
Clinorule
Curved borehole (oriented core)
Curved borehole (televiewer)
Linear (e.g. scanline)
Linear borehole (televiewer)
Planar (e.g. wall map)
Viewing Options :
Current view state saved with file
Global undo/redo
Improved printing with customizable headers and footers
Interactive graphical editing
Save plots to .bmp, .jpg, .metafile, .png, .gif
Sidebar for quick access to display
Product Reference
Add Review

Profile Deletion
Warning message : Are you sure that you want to delete your Prospectwiki account? Please note that there is no option to restore the account or data nor reuse the username once deleted. Your account will be permanently deleted within 2 Working days.
Welcome to Prospectwiki