Product Overview
ManageEngine OpManager is a network management solution that includes network and server monitoring, bandwidth analysis, configuration management and fault management. The solution is suitable for businesses of all sizes
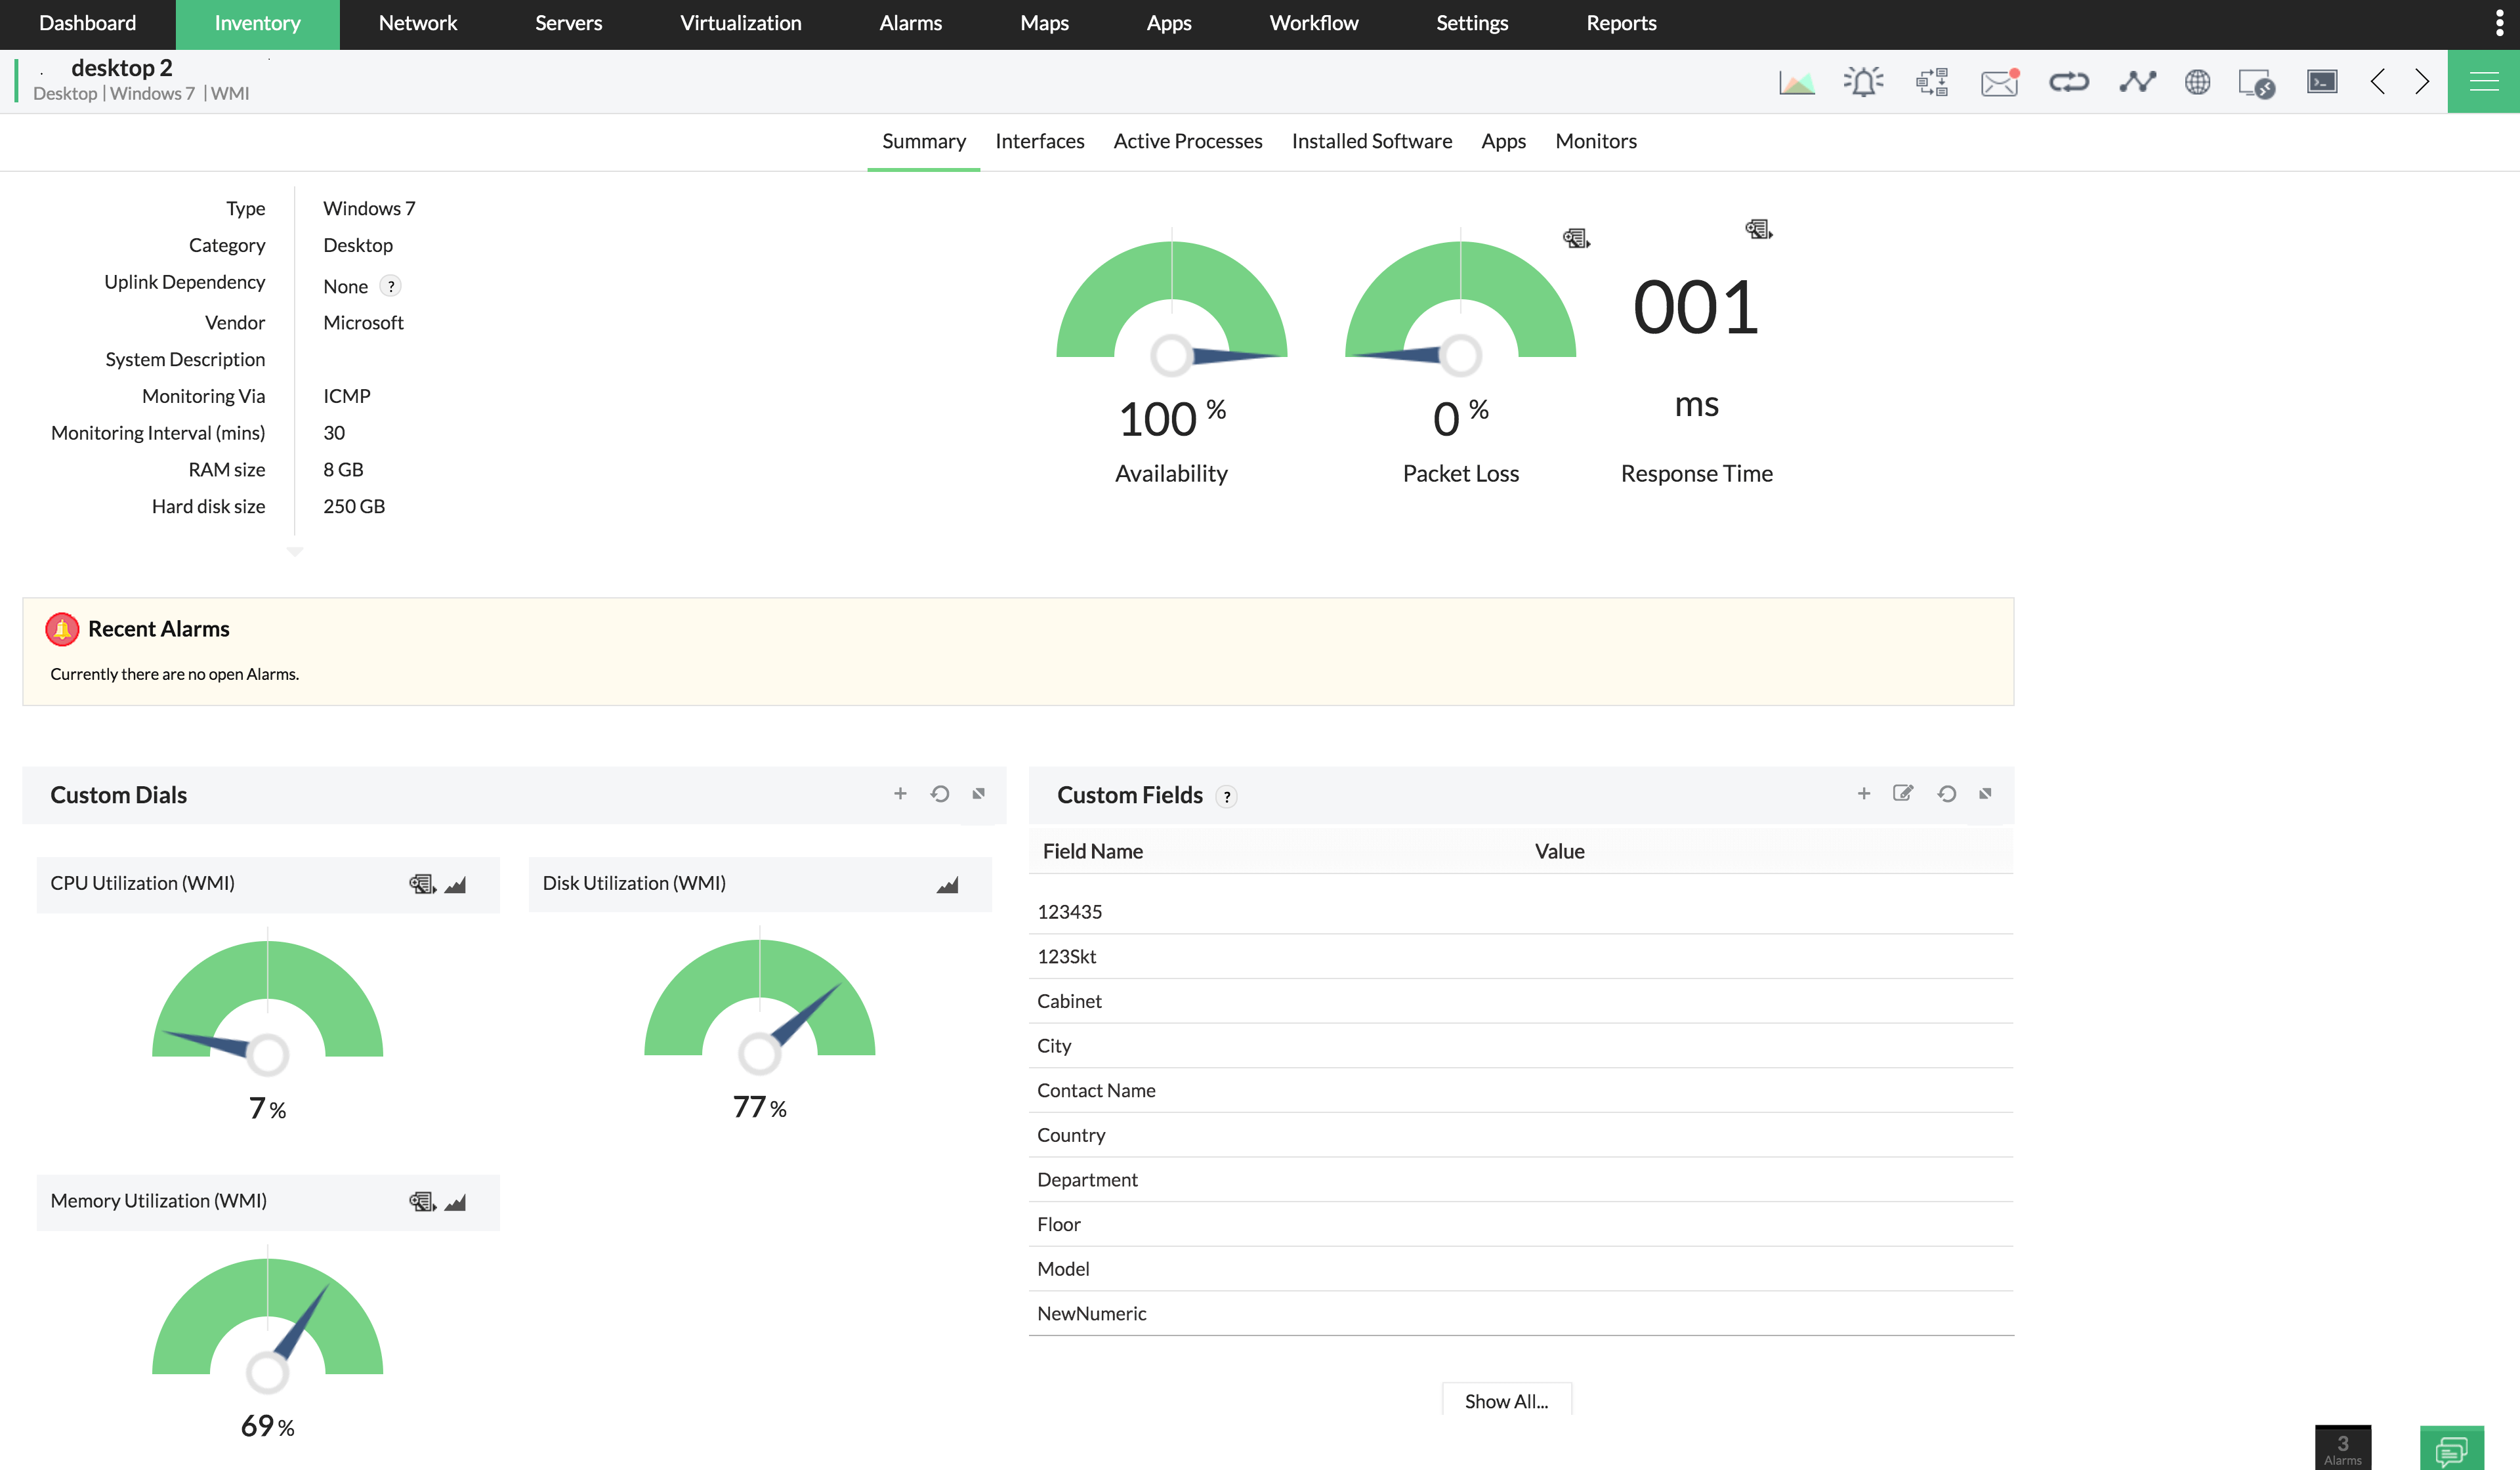
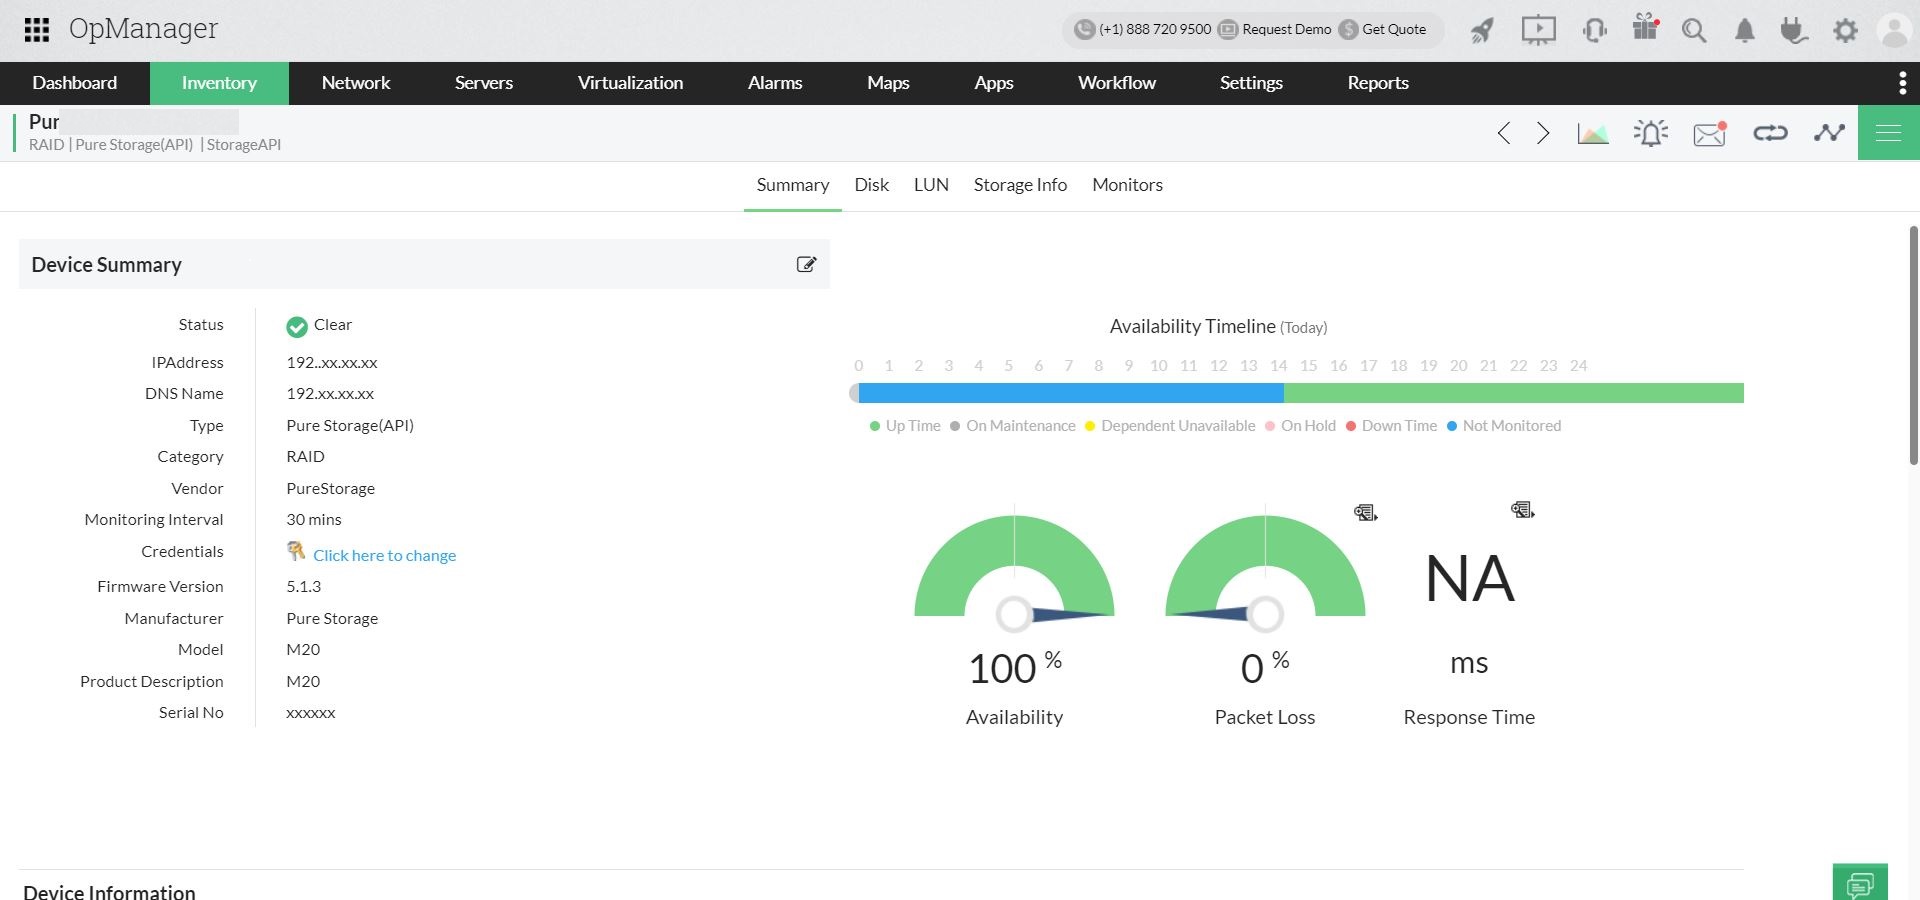
OpManager allows users to monitor availability, traffic, packet loss, performance metrics and response time of various devices including servers, routers, switches and virtual machines. If any equipment goes down, OpManager sends automatic notifications to relevant users via text message or email.
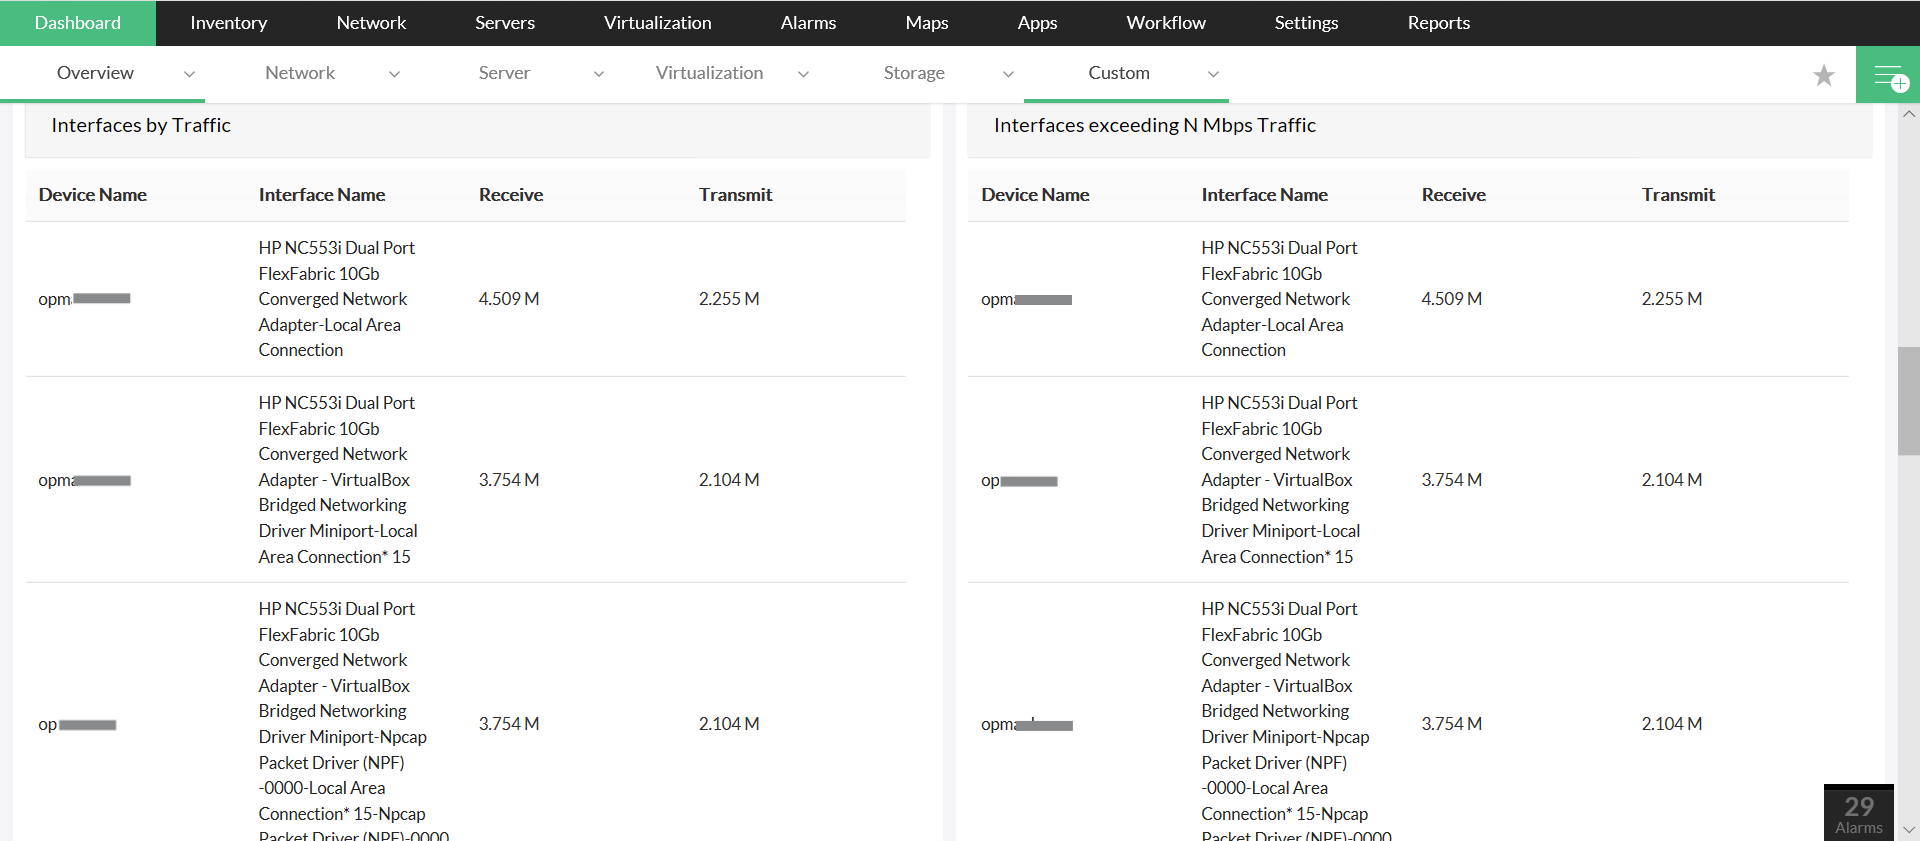
OpManager analyzes network traffic patterns and bandwidth consumed by different devices and applications via sFlow, IPFIX, jFlow and NetFlow in order to configure traffic to balance the system. It helps users see bandwidth consumption and performance metrics on a single screen.
OpManager supports Windows and Linux operating systems. OpManager can also be accessed via dedicated mobile apps available for Android and iOS devices. pricing is one-time fee. Support is via online forum and phone.
Specifications
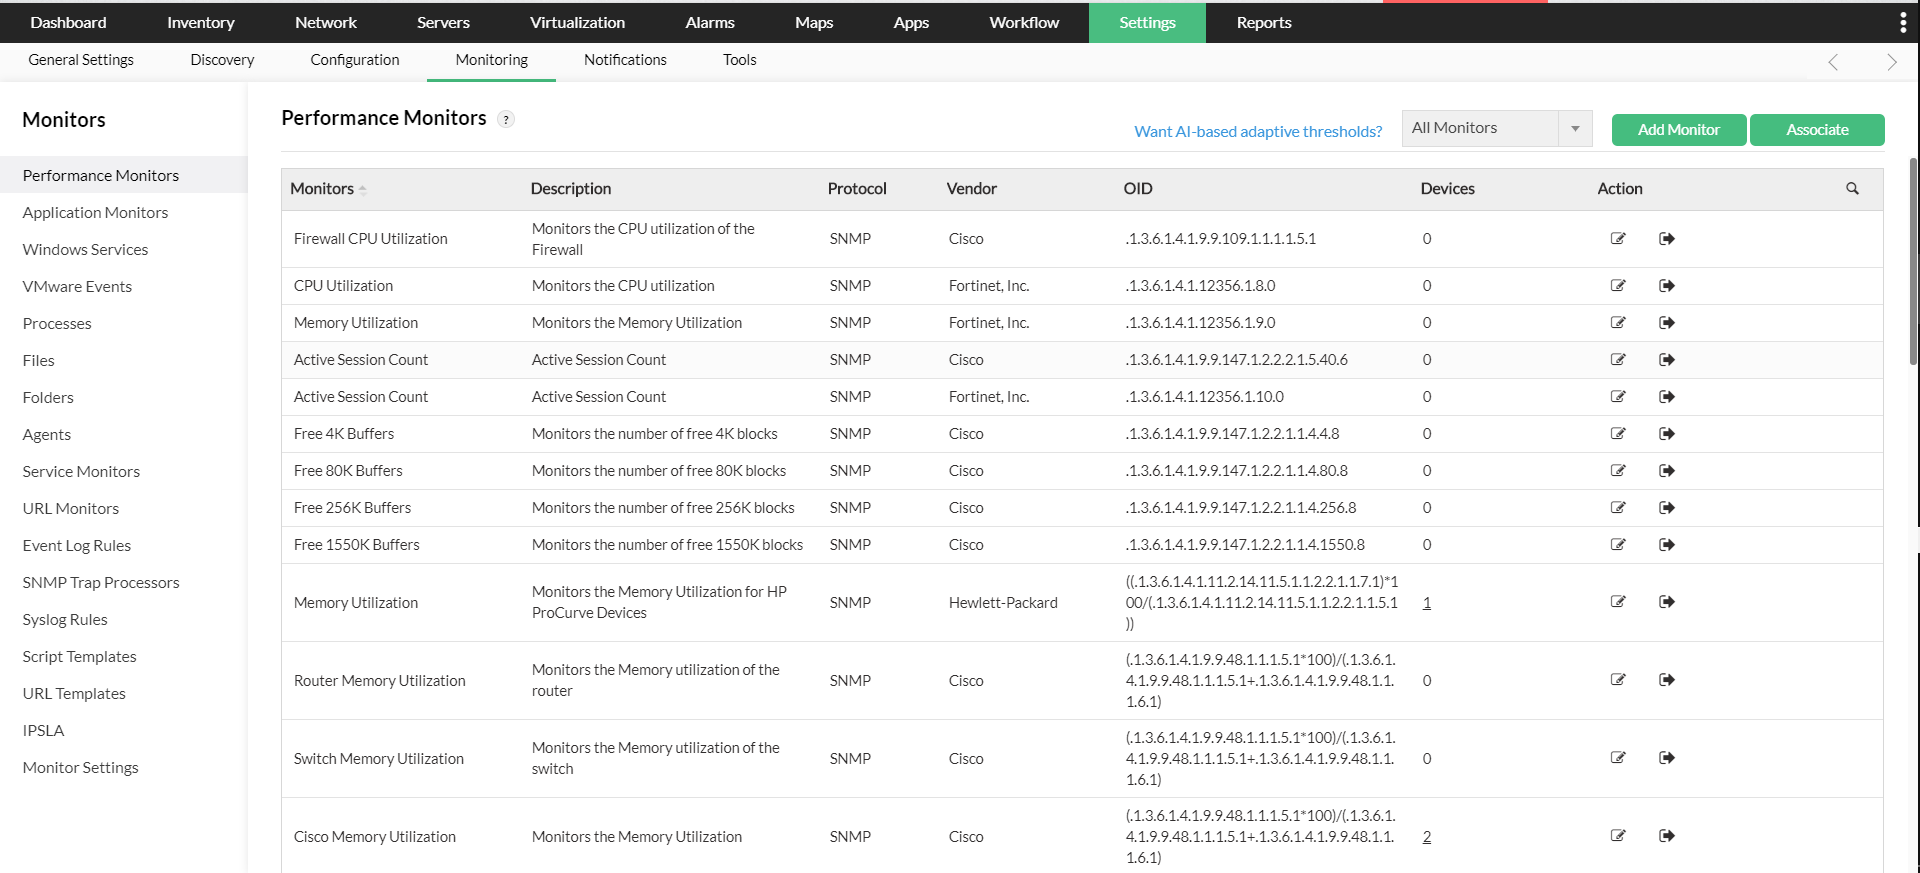
Network performance monitoring
Networks are the backbone of every business. Even in small or enterprise-level businesses, the loss of productivity during a network outage can result in hefty damages. Network monitoring solutions helps you anticipate potential outages and address network problems proactively. This helps in maintaining a congestion-free network that keeps your business up and running. This can be achieved with the help of network monitoring tools. A network monitor software helps you to monitor the performance of any IP-based device and helps businesses remotely visualize their system performance and monitor network services, bandwidth utilization, switches, routers and traffic flow. Once you have identified network issues, network optimization helps in improving the performance to a desired level.
- Important factors of a network performance monitor.
- Availability
- CPU and memory
- Traffic
- Errors and discards
- WAN performance
Server Monitoring
Server monitoring is the process of monitoring a server's system resources like CPU Usage, Memory Consumption, I/O, Network, Disk Usage, Process etc. Server Monitoring metrics also helps in capacity planning by understanding the server's system resource usage. A server monitoring tool helps in automating the process of server monitoring. Monitoring server performance also helps in identifying other performance related issues like resource utilization, app downtime and response time.
Why is it important to monitor server performance?
To monitor server availability and data loss.
To monitor the responsiveness of the server.
To know the server capacity, user load and speed of the server.
To detect and prevent any issues that might affect the server proactively.
Network mapping: The definition
Network mapping is a process used to discover new devices, interfaces and visualize physical and virtual network connectivity. Network topology mapping provides complete visibility into your IT infrastructure. Network mapping tools aid in simplifying network monitoring by pinpointing network faults.
Importance of network mapping
The network mapping outlines your network and any device linked to that network visually. These network maps offer visuals that are easy to comprehend and demonstrate how devices perform on your network. Let's discuss why and the major benefits of mapping your network:
Gain unified view into network devices: With a network map ,your network and its accompanying information can be viewed in a single pane. Each device linked to the network is displayed graphically using a network map software.
Quicker fault diagnosis and troubleshooting: In case of any issues, your network map can help you instantly discover which devices have problems, so you can easily see where the problem lies. In this way, your network map ping tool can be the difference between knowing the exact problem location you need to work on, and hours of guesswork. You can also prioritize and troubleshoot network faults that need your immediate attention.
Better forecasting and planning: A network map enables you to plan your network architecture by representing various network components. A dynamic map with up-to-date metrics can help you in making better decisions when planning storage capacity or upgrades and optimizations for an existing network.
Network fault management
Identify network faults and start resolving them long before your boss or an end user calls
The FCAPS model of ISO lists fault management as one of the five core functional areas of proactive network management and defines its goal: to recognize, isolate, correct, and log faults that occur in the network.
Network fault management is the process of finding, isolating, and troubleshooting network faults in the fastest way possible. Fault management is a crucial component of network management that minimizes downtime and prevents device failures by resolving faults rapidly, thereby ensuring optimal network availability and preventing business losses.
Network fault monitoring is the first step of fault management and thus a requirement for successful network management. The increasing complexity of hybrid network infrastructures would make the fault management process burdensome if not for fault management systems.
Data center monitoring
Data centers are at the heart of operation for any enterprise that utilises an IT infrastructure. They essentially host business applications and storage space for the entire business network. Data centers might be anything from just a single rack with a couple of servers, to those spanning across cities or even countries.
Real time datacenter monitoring becomes paramount when organisations want to ensure low downtime and improve overall performance of your data center. However, there are several vital aspects to be monitored, which becomes virtually impossible as the size of the data center increases.Hence, a proper datacenter monitoring tool has to be deployed.
To ensure the best performance from your data center, it is crucial to implement data center performance monitoring based on three important parameters - network connectivity, server performance and storage performance. The main setback admins face while executing this, is the lack of an integrated data center monitoring solution that provides you visibility over all these three aspects.
ManageEngine OpManager helps you manage and monitor all the different aspects of your data center's performance, all from an unified console. By monitoring critical performance metrics of your data center in real time, OpManager functions as a complete data center monitoring system and enables you to maintain your data center resources at its peak performance levels.
SAN Monitoring
Storage Area Network (SAN)
From hosting applications to serving large multimedia, organizations are counting on their IT infrastructure to deliver unmatched end-user experience. To provide such exceptional experiences, the application availability and the performance have to be greatly enhanced. A storage area network (SAN) is employed exactly to tackle these challenges, out of many others, as the application performance is directly linked to storage latency.
A SAN is a dedicated, high speed network, containing pools of storage devices, providing block-level storage. A SAN is separated from a LAN (sometimes through virtualization), so administrative traffic does not interfere with business services. SAN is essential to an enterprise network as it:
Consolidates storage devices making management relatively easy
Utilizes storage devices effectively by pooling them
Enhances performance by reducing storage latency
Improves application availability through redundancy
Simplifies data backup (without server interaction)
Supports multiple storage device types such as Tape Libraries, RAIDs, and more
Just like any other networking infrastructure, it is crucial to monitor the SAN for its availability, health and performance to ensure disruption-free services 24/7 with a feature-rich SAN monitoring tool. SAN performance monitoring tools should effectively monitor various aspects of a SAN including storage devices such as RAIDs, Tape Libraries, etc. from multiple vendors and SAN switches.
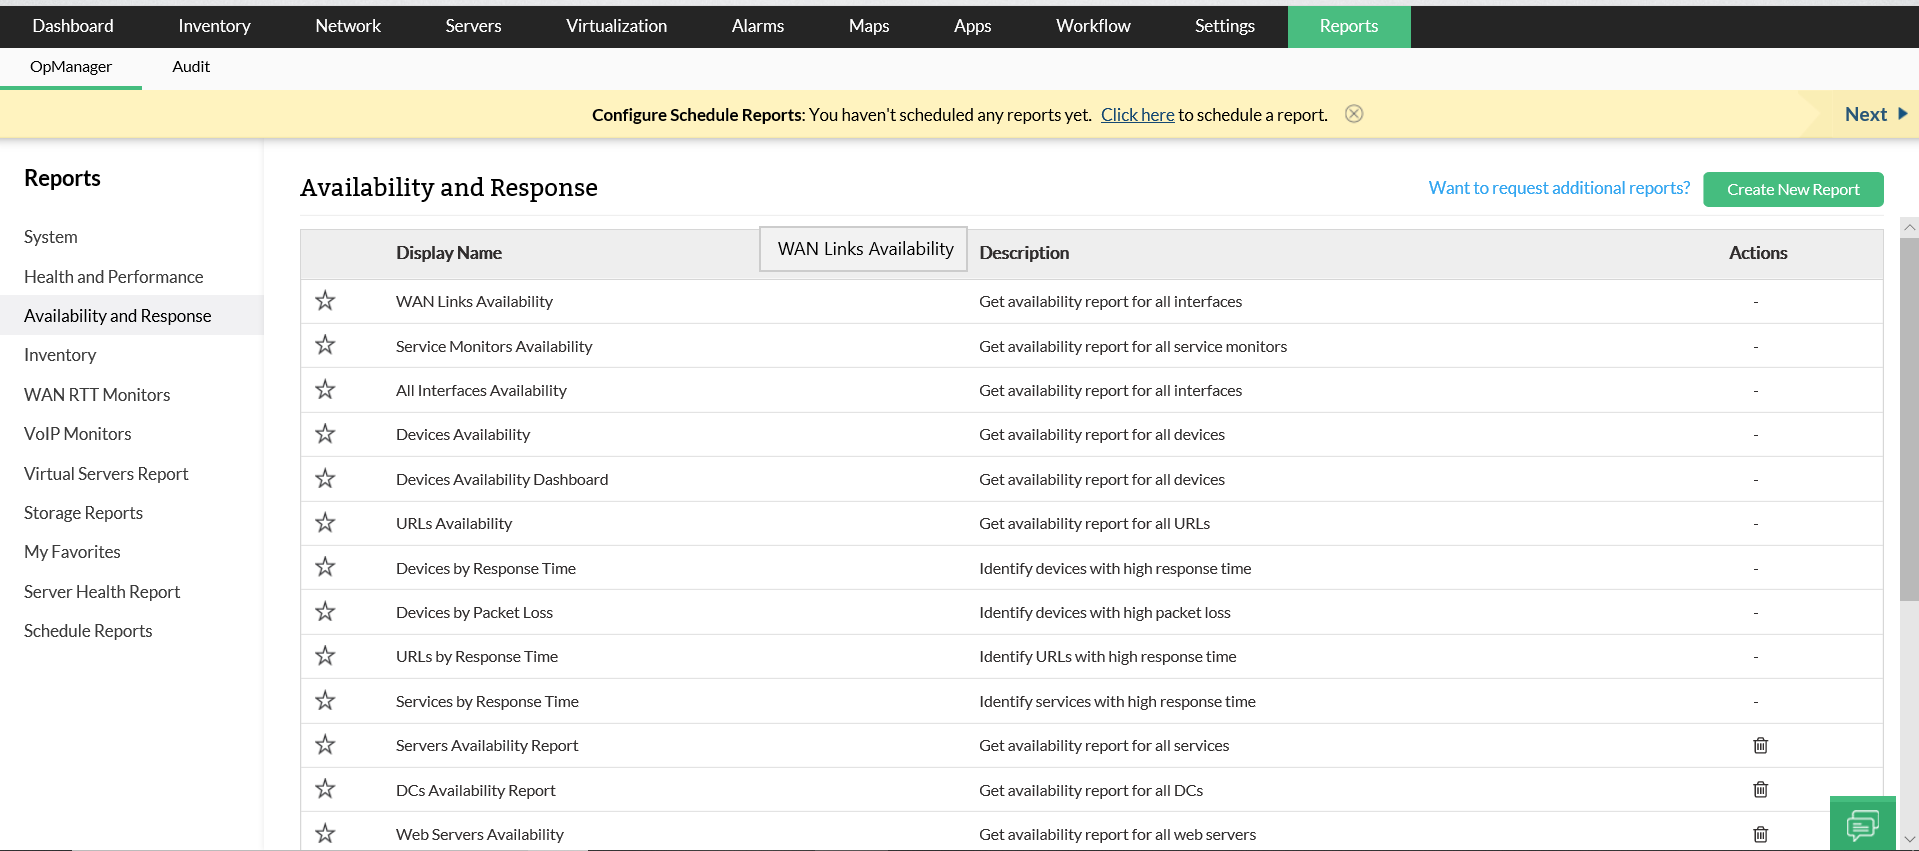
Scheduled, automated emailing of periodic reports
It is not just network fault notifications that OpManager sends to you wherever you are, anytime of the day. OpManager's Report Scheduler allows you to automate creation of reports as well as have these reports periodically mailed to desired recipients. The report creation is aided by a number of flexible provisions which help make powerful, extensive reports. A few frequently used examples of automated reports are given below:
An end-of-day report on the availability of all the servers in the Datacenter
Weekly performance report of all your servers' CPU, memory and disk utilization
An end of day report on the availability & performance of all the devices in a particular business servicing group e.g. the ERP system
Monthly reports on the bandwidth utilization on all router interfaces
Enterprise Monitoring Tools
IT infrastructure has become the bedrock for delivering essential business services, be it internal administrative operations or application services hosted for customers. Monitoring IT infrastructure is crucial and has already been established. SMB IT infrastructure requires simple network monitoring tools for monitoring performance and reporting issues. Usually, a couple of IT admins configure networking devices, firewalls, and manually troubleshoot network issues when they arise.
This is totally feasible when the network has a few hundred devices. It is not practical for an enterprise network since it has thousands of networking devices. Enterprise networks have increasing hardware requirements, need dedicated IT teams, and could be geographically distributed.
Enterprise infrastructure monitoring tools should:
Scale with the enterprise network
Monitor multiple branch offices in real-time
Support multi-vendor networking hardware
Automate manual, routine tasks (configurations)
Manage and define user roles since monitoring involves numerous IT staffs
Apart from the above, it is fair to expect an enterprise monitoring tool to be easy to use, sophisticated, and all-inclusive in monitoring capabilities.
Have Question ?
Get in touch!
Product Reference
Add Review

Profile Deletion
Warning message : Are you sure that you want to delete your Prospectwiki account? Please note that there is no option to restore the account or data nor reuse the username once deleted. Your account will be permanently deleted within 2 Working days.
Welcome to Prospectwiki